

Table of Contents
A customer sends you a message: “The export isn’t working.”
You ask what happened. They say they clicked Export, waited, and saw an error. You don’t know which account they used, which file they selected, whether the request reached your server, or whether the problem started after your latest deployment.
You open the code and start guessing.
That is where debugging becomes expensive. You can spend an hour changing code without knowing whether the failure came from the browser, an API route, a database query, a third-party service, or a recent release.
When you are the developer, tester and person responsible for production, you need a repeatable process. The goal is to turn an unclear report into a specific failure, identify the relevant evidence, and restore the expected behavior without creating another problem.
This guide explains how to debug a SaaS in production using a workflow designed for one developer. It covers report capture, log investigation, safe reproduction, fix-versus-rollback decisions, and a prevention note you can keep with your project.
The example later in the article is illustrative. It is not a report of an actual IndieOS production incident.
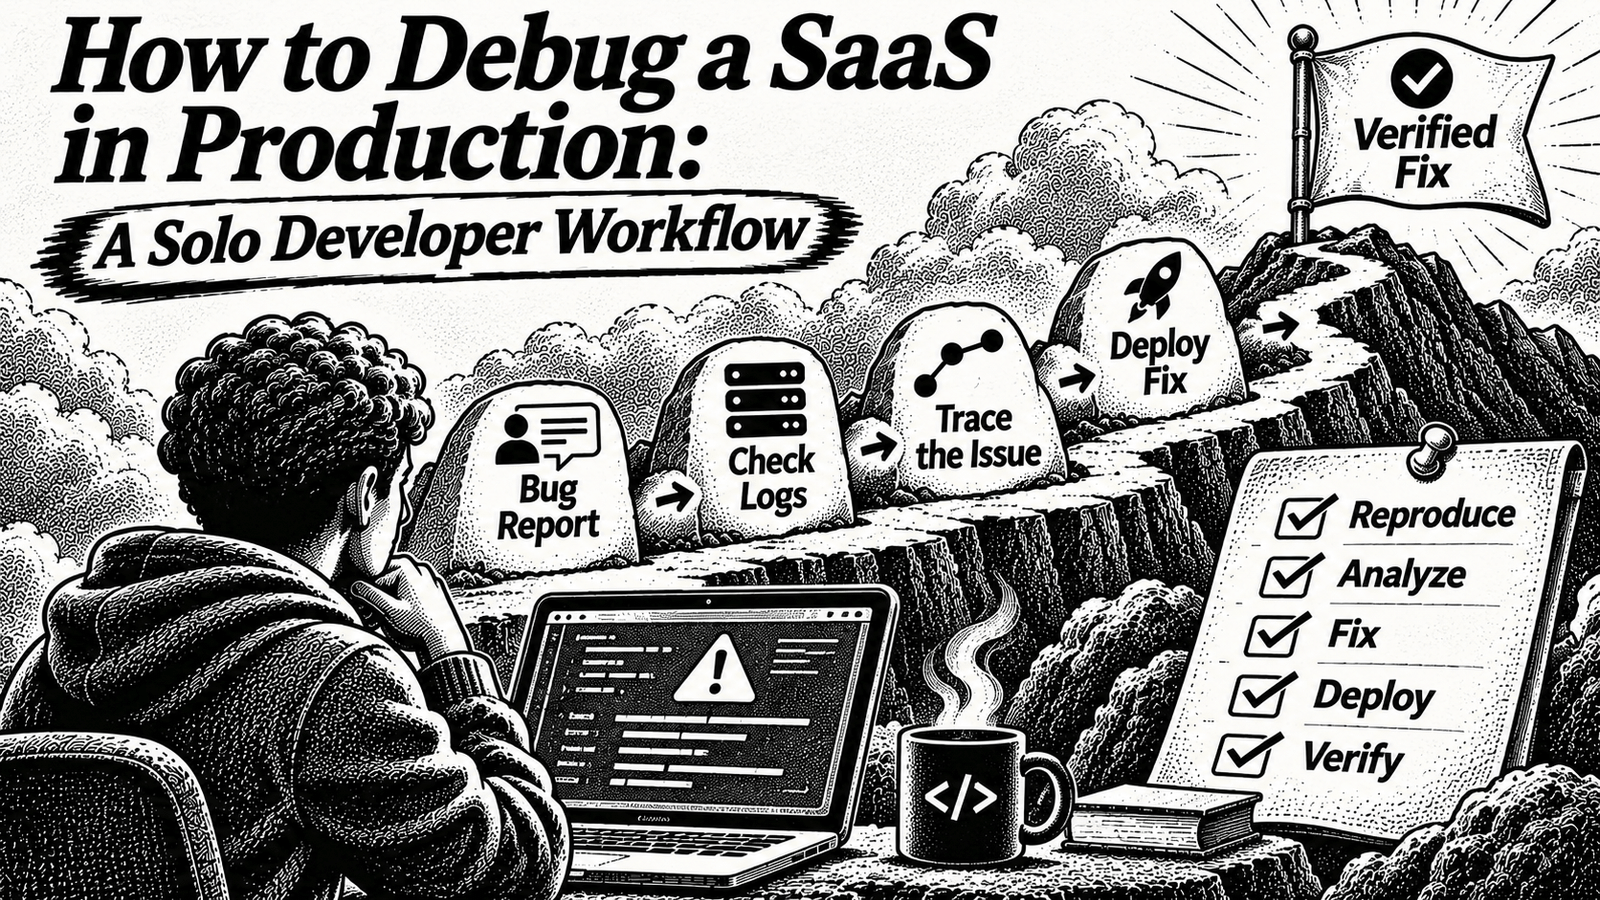
The five-stage workflow at a glance
Do not start by changing code. Start by narrowing the problem.
| Stage | Your job | Evidence you should have |
|---|---|---|
| 1. Capture | Turn the customer report into useful information | Reproduction details and impact |
| 2. Trace | Find the relevant request and deployment | Request ID, timestamp, logs and version |
| 3. Reproduce | Confirm the failure without risking customer data | Repeatable steps in a safe environment |
| 4. Recover | Fix forward or restore the previous working version | A verified change or a completed rollback |
| 5. Prevent | Record what happened and close the gap | Incident note, regression test or monitoring improvement |
This is a lightweight solo workflow, not a replacement for a formal incident-management process in a business with on-call teams and contractual response obligations. Google’s Site Reliability Engineering incident guide makes the same broader point: preparation, mitigation, communication and learning all matter, not just the code fix.
1. Capture a useful bug report before investigating
The first message you receive is rarely a complete bug report.
“Dashboard is broken” tells you almost nothing. “The dashboard returns an error after I change the date filter, but only in our team workspace” gives you somewhere to start.
Your first task is to collect enough information to reproduce or locate the failure.
Ask for these details
| Field | What to collect | Why it matters |
|---|---|---|
| Time | Approximate occurrence, including timezone | Narrows the log search |
| Environment | Production, preview or local | Avoids investigating the wrong deployment |
| Account | A safe internal account or workspace reference | Helps identify the affected scope |
| Route | Page or API endpoint involved | Narrows the relevant code path |
| Action | What the user clicked or submitted | Identifies the operation |
| Expected result | What should have happened | Defines correct behavior |
| Actual result | What happened instead | Describes the failure |
| Frequency | Every time, sometimes or once | Helps distinguish deterministic failures |
| Error reference | Request ID or trace ID, if available | Connects the report to logs |
| Recent change | Whether the issue began after a release or configuration change | Helps identify likely regressions |
You do not need a long interview. Start with the three details that remove the most uncertainty:
- What were you doing immediately before the error?
- What did you expect to happen, and what happened instead?
- When did it happen, and can you share the error reference?
Ask for a screenshot only when it adds useful context. A screenshot of an error message can help, but it usually cannot tell you what happened on the server.
Use a report template
Keep this small template in your issue tracker, support inbox or project notes.
Production bug report
Report ID:
Reported at:
Timezone:

Environment:
Affected route:
Action performed:

Expected result:
Actual result:

Reproduction steps:
1.
2.
3.

Frequency:
Affected account/workspace reference:
Request ID:
Trace ID:

Browser/device:
Recent deployment or configuration change:

User impact:
Temporary workaround:

Sensitive information removed? Yes / No
Do not ask customers to send passwords, access tokens, payment-card information, private documents or other sensitive data to help you debug.
Decide how urgent the issue is
Not every production error requires the same response.
Use a simple severity convention for your own workload. These are suggested operational categories, not an official industry-wide classification.
| Priority | Example | First response |
|---|---|---|
| Critical | Customer data exposure, suspected compromise, widespread data loss or a payment-integrity problem | Contain the risk and restore safe operation |
| High | A core workflow is unavailable for multiple customers | Prioritize service recovery |
| Normal | One customer is affected and a safe workaround exists | Investigate and communicate the workaround |
| Low | Cosmetic or isolated issue with no meaningful loss of function | Schedule a controlled fix |
Security incidents and suspected data exposure need containment and an appropriate incident-response process. Do not treat them as ordinary interface bugs.
Output of this stage: A report with a time, affected feature, expected behavior, observed behavior and enough context to search the right system.
2. Find the relevant trail in production logs
Once you have a useful report, look for evidence around the time of the failure.
A log search becomes much easier when you know the environment, route, approximate timestamp and request identifier.
Start with the deployment
Check whether the problem appeared after a recent deployment.
Record:
- The current production deployment.
- The deployment that was active before the issue started.
- The relevant commit or change.
- Whether the affected feature changed.
- Whether environment variables, database schema or third-party configuration changed.
A bug that appears immediately after a release is a useful clue. It is not proof that the release caused it.
Find the request
For a Vercel-hosted application, Vercel’s runtime logs let you filter by environment, status code, route, request path, deployment, method and request ID.
You can also inspect the runtime log details to see information associated with the request.
Start with a bounded time window and narrow the query.
For example, with the Vercel CLI:
# Inspect recent production server errors
vercel logs --environment production --status-code 500 --since 1h
To inspect a specific request when you have its request ID:
vercel logs --request-id req_xxxxx --expandThe request ID above is a placeholder. Replace it with the actual identifier from your log entry.
For build failures, inspect the deployment’s build logs instead. Build logs and runtime logs answer different questions: build logs show what happened while creating the deployment, while runtime logs show what happened when the application processed requests.
Official references:
Do not confuse a request ID with a trace ID
A request ID helps identify a particular request in a platform’s logs. A trace ID can connect the work performed across multiple services or components.
For example, one user action might trigger:
- A browser request.
- An API route.
- A database operation.
- A background job.
- A call to an external service.
If each part records useful correlation information, you can follow the request rather than searching unrelated log messages by guesswork.
OpenTelemetry defines fields such as TraceId and SpanId for connecting log records with traces. Its logs documentation explains how these identifiers help correlate application activity.
Use structured logs
A message such as Something failed is not very useful.
A structured event gives you searchable context:
{
  "timestamp": "2026-11-02T10:30:00Z",
  "level": "error",
  "event": "export_failed",
  "environment": "production",
  "route": "/api/exports",
  "method": "POST",
  "status": 500,
  "requestId": "req_demo_123",
  "traceId": "4bf92f3577b34da6a3ce929d0e0e4736",
  "deployment": "deployment-demo",
  "errorCode": "STORAGE_TIMEOUT"
}
All identifiers and values in this example are fictional. It illustrates a useful event shape, not actual production logs.
The important fields are the time, severity, event, environment, route, deployment and correlation identifiers. Add only the context that helps investigate the problem.
Protect the logs themselves
Production logs can contain more sensitive information than developers expect.
Do not record:
- Passwords.
- Access tokens.
- Database connection strings.
- Encryption keys.
- Payment-card data.
- Private customer documents.
- Sensitive personal information that is not needed for diagnosis.
Use a safe account reference or pseudonymous identifier where possible. Mask or remove sensitive values before storing or sharing logs.
OWASP’s Logging Cheat Sheet provides detailed guidance on event fields, sensitive data exclusions, sanitization and log protection.
Output of this stage: A specific request or trace, the relevant deployment and the log events associated with the reported behavior.
3. Reproduce the failure safely
Finding an error in a log does not automatically tell you why it happened.
You now need to establish whether the failure can be reproduced and under what conditions.
Reproduce the same conditions
Compare the report with your local or staging setup.
Check:
- Application version.
- Environment variables and configuration.
- User role and permissions.
- Account or workspace state.
- Input values.
- Database state.
- External-service behavior.
- Browser or client conditions, if relevant.
A bug may only happen for a particular role, record state, file size, date range or workspace configuration.
Do not change several variables at once. Change one condition, repeat the action and record what happens.
Never use production as your experiment
Do not repeatedly replay a customer action against live data just to see whether it fails again.
This is especially important for operations that:
- Charge a payment method.
- Send an email or notification.
- Delete or overwrite records.
- Change subscription access.
- Trigger background jobs.
- Modify customer-owned files.
- Create irreversible external side effects.
Prefer an isolated staging environment with synthetic test data. When staging cannot reproduce the same state, use a safe read-only investigation first and create an anonymized copy of the necessary conditions.
Never copy production secrets into a local test environment simply because it makes the bug easier to reproduce.
Write down the smallest reproduction
A good reproduction should be short enough that another developer could follow it.
For example:
Environment: Preview
Account: Test workspace with editor role

1. Sign in.
2. Open the exports page.
3. Select the monthly date range.
4. Submit the export request.
5. Observe the response.

Expected:
An export job is created.

Actual:
The API returns an error and no export appears.
This is a fictional example. Replace it with the actual conditions from your own report.
When you can reproduce the same result more than once, you have a stronger basis for finding the cause. When you cannot, keep the issue classified as intermittent or unreproduced instead of assuming it is fixed or harmless.
Output of this stage: A controlled, repeatable reproduction or a clear list of the conditions you could not recreate.
4. Choose between fixing forward and rolling back
Once you understand the failure well enough to act, decide whether to repair the new code or restore the previous working deployment.
Do not make the decision based only on which option feels faster.
Fix forward when the problem is understood
Fix forward when:
- The cause is reasonably isolated.
- The correction is small and reviewable.
- You can verify the change before production.
- The affected behavior can be tested.
- A rollback would not be safer or simpler.
A typical process is:
- Make the smallest appropriate change.
- Run relevant tests locally.
- Deploy a preview.
- Reproduce the original steps against the preview.
- Check the relevant logs.
- Deploy the verified fix to production.
- Repeat the original check in production.
With Vercel, the workflow can include:
# Deploy a preview
vercel deploy

# Test the affected route on the preview deployment
vercel curl /api/exports --deployment <preview-url>

# Deploy the verified change to production
vercel deploy --prod
Replace the route and deployment URL with your own. These are Vercel-specific commands; other hosting providers have different deployment workflows.
Roll back when restoring service is the safer option
A rollback may be appropriate when:
- The problem started with a recent deployment.
- The previous production version was working.
- The new release causes widespread failures.
- You cannot safely prepare a verified fix quickly.
- Returning to the previous application version reduces customer impact.
For a Vercel deployment, the CLI supports:
vercel rollback
vercel rollback status
The rollback command points production traffic to a previous production deployment. Check the rollback status and verify the affected user journey afterward.
Read the official Vercel production rollback guide before relying on this process.
Be careful with database changes
An application rollback and a database rollback are not the same thing.
Suppose a deployment changes a database column and the new application version starts using that column. Returning only the application code to the previous version may leave it incompatible with the current database schema.
Database changes may also have modified or removed data that cannot simply be restored by changing the application deployment.
For schema changes that need to remain compatible across releases, consider an expand-and-contract migration: add the new structure, migrate or backfill data, switch application usage, then remove the old structure in a later change.
Prisma’s production migration guidance explains this pattern. The details depend on your database and migration system.
Decision rule: Restore service first when the current release is causing serious user impact and a safe rollback path exists. Fix forward when the cause is understood and the correction can be verified safely. Treat database state as a separate part of either decision.
5. Verify the fix instead of trusting the deployment
A deployment marked successful only tells you that the deployment completed. It does not prove that the reported bug is gone.
Return to the original report.
Run the same steps that caused the issue and check the expected result.
Then test one or two related failure conditions. For example:
| Original failure | Related check |
|---|---|
| Export fails for a date range | Test another valid date range |
| File upload fails | Test an invalid file and a permitted file |
| A user cannot open a page | Test the intended role and a restricted role |
| Checkout fails | Test the relevant successful and cancelled paths in the provider’s test environment |
| A record update fails | Verify persistence after reloading |
Check the production logs again. Look for the same error event, route, request type or failure signal.
A fix is not complete merely because you cannot see the error in one browser session. Confirm the behavior through the original workflow and whatever monitoring is appropriate for the issue.
Also make sure that your verification did not create duplicate payments, emails, records or background jobs.
6. Write the prevention note
Once the incident is resolved, write down what happened while the evidence is still available.
Keep it short. The purpose is not to write a long report after every small issue. It is to preserve the information that would make the next investigation quicker.
Use this template:
Incident ID:
Date:
Affected feature:
Severity:

What users experienced:
When it started:
Affected deployment:

Detection:
How the issue was discovered:

Technical cause:
Evidence supporting the cause:

Immediate mitigation:
Permanent fix:
How the fix was verified:

Why the issue was not caught earlier:
Regression test or monitoring improvement:

Follow-up task:
Status:
Separate what you know from what you suspect.
For example:
- Verified: The affected route returned an HTTP 500 response.
- Verified: The error started after deployment
deployment-demo. - Verified: The preview deployment passed the original reproduction steps.
- Unconfirmed: The change may have caused the problem by changing the expected response shape.
Do not turn a plausible explanation into a confirmed root cause without supporting evidence.
Google’s SRE incident-management guidance recommends documenting incidents and using postmortems to learn from failures, including improvements to detection, mitigation and communication. You can apply the same principle at solo scale without copying an enterprise process. See Google’s Incident Management Guide.
A prevention note should create at least one useful follow-up:
- Add a regression test.
- Improve an error message.
- Add a missing log field.
- Create an alert for a customer-facing failure.
- Document a safe rollback procedure.
- Improve a deployment or database migration check.
If the incident cannot be prevented completely, record how you will reduce its impact or detect it sooner.
A complete illustrative debugging walkthrough
Consider a fictional SaaS where a customer reports that a report export fails.
The following example shows how the five-stage workflow might be applied. It is a teaching scenario, not a real company incident or an IndieOS test.
Initial report
Feature: Report export
Environment: Production
Action: User submits export request
Expected: Export becomes available
Actual: User sees an error
Time: 10:30 UTC
Request ID: req_demo_123
Stage 1: Capture
The report is missing the account state and exact input. You ask for the selected date range and confirm whether the user can repeat the issue. You use a safe test account reference rather than requesting private customer data.
Stage 2: Trace
You search the relevant production time window and locate a failed request for the exports route. The request ID links the report to the runtime log. You record the deployment ID and inspect the associated error event.
Stage 3: Reproduce
You recreate the relevant account permissions and request parameters in staging. The same action produces the same failure. You now have a repeatable test instead of a vague customer complaint.
Stage 4: Recover
You compare the failing code path with the previous deployment and isolate a change that affects export processing. You choose a fix-forward only after checking the expected behavior and confirming that the preview deployment handles the original reproduction successfully.
Stage 5: Verify and prevent
You repeat the original export request against the verified deployment. You confirm that the expected export is created, check that the error no longer appears, and add a regression test for the affected condition.
The incident record contains the evidence, the actual cause, the correction and the follow-up test.
Notice what made the investigation manageable: the report was narrowed before code changed, the logs were tied to a specific request, reproduction happened outside production, and the fix was checked against the original failure.
Common production debugging mistakes
Changing code before collecting evidence
A quick code change can hide the original cause or introduce a second failure. Capture the report, deployment and relevant logs first unless immediate containment is required.
Searching logs without a time window
Large log streams create noise. Start with the reported timestamp, correct timezone and a small range. Expand the range only when needed.
Logging too little context
An error message without a route, event name or correlation identifier may be impossible to connect to the customer’s report. Improve structured logging before a serious failure occurs.
Logging too much sensitive data
Debugging does not justify storing credentials, tokens or private customer data. Follow the OWASP Logging Cheat Sheet and define what your application must never record.
Reproducing a live operation against real customer data
A debugging attempt can send duplicate notifications, charge customers or modify records. Use staging and synthetic data wherever possible.
Assuming a rollback fixes the database
Restoring an earlier application deployment does not automatically undo schema or data changes. Review both application and database compatibility before rolling back.
Closing the issue without a prevention step
A fix can resolve today’s report while leaving the same failure easy to trigger again. Record one concrete test, alert or process change before closing an incident.
Frequently asked questions
How do you debug a SaaS in production when a customer report is vague?
Start by collecting the time, affected route, action, expected result, actual result and available request or trace identifier. Use those details to search production logs and narrow the failure before changing code.
What should a production bug report contain?
At minimum, it should contain when the failure happened, where it happened, what the user did, what they expected, what occurred instead, how often it happens and any safe error reference available.
How do logs help reproduce a production bug?
Logs connect a report to application events. A timestamp, route, deployment and request identifier can narrow the relevant code path. Trace identifiers can connect activity across multiple application components when trace context is recorded and propagated.
When should a solo developer roll back a production deployment?
Consider a rollback when a recent deployment is strongly associated with a serious failure and the previous version is known to be safe to restore. Check database compatibility and verify service after the rollback.
What should you do when a production bug cannot be reproduced locally?
Compare the application version, configuration, permissions, data state and external services. Use sanitized evidence and an isolated staging environment. Record the conditions you could not reproduce rather than claiming the issue is fixed.
Do you need a full incident-management system as a solo developer?
Not necessarily. A bug-report template, searchable logs, a safe staging environment, a tested recovery path and a short incident record are a practical starting point. More formal coordination becomes important as customer impact, system complexity or response obligations grow.
Final takeaway
Production debugging becomes easier when you stop treating every report as an invitation to guess.
Capture the details, locate the request, reproduce the failure safely, choose the right recovery path, and record what should change to prevent a repeat.
You do not need an enterprise incident-management platform to follow this process. You need enough evidence to make each decision deliberately and a habit of checking that the fix actually restored the customer’s workflow.
Sources and further reading
- Vercel: Runtime Logs
- Vercel: Debugging production 500 errors
- Vercel: Rolling back a production deployment
- OpenTelemetry: Logs
- OWASP: Logging Cheat Sheet
- Google SRE: Incident Management Guide
- Prisma: Production database migrations
Platform documentation reviewed on 2 November 2026. Hosting commands and interface details are platform-specific; check the linked official documentation before using them in production.


[…] For further technical guidance, see how to debug a SaaS in production. […]