

Table of Contents
You have launched your SaaS. You shared the announcement, posted in communities, emailed your audience and watched visitors arrive.
But what actually happened?
Perhaps your launch received plenty of attention but very few signups. Perhaps people signed up but never used the product. Or perhaps only a handful of people visited, but several became paying customers.
Without the right measurements, all three situations can look like success or failure for the wrong reasons.
The purpose of launch metrics is not to collect as many numbers as possible. It is to understand what happened between someone discovering your product and becoming a customer who receives value from it.
This guide explains which SaaS launch metrics to track, how to calculate them, how to compare acquisition channels and how to build a simple launch scorecard without an expensive analytics setup.
1. Decide what a successful launch means before launch day
Before choosing metrics, decide what you want the launch to accomplish.
Different launches have different objectives.
| Launch objective | What you are trying to learn | Useful measurements |
|---|---|---|
| Generate awareness | Are relevant people discovering the product? | Reach, impressions, visitors, referral sources |
| Attract early users | Are people interested enough to try it? | Signups, signup conversion rate |
| Validate positioning | Do visitors understand the product and its value? | Qualified visits, CTA engagement, signup reasons, feedback |
| Test activation | Can new users reach the product’s core value? | Activation rate, completed key actions |
| Generate revenue | Will customers pay for the solution? | Paid customers, paid conversion, new MRR |
| Test retention | Do early users return and continue using it? | Returning users, cohort retention, repeat usage |
Choose one primary objective and a small number of supporting objectives.
For example, a first public launch might aim to attract relevant early adopters and observe whether they complete the product’s main workflow. A later launch may focus on converting existing users into paid subscribers.
Do not judge both launches using exactly the same success criteria.
Product Hunt’s official launch guidance also recommends deciding what a win looks like before launch day, such as feedback, early adopters or momentum. It emphasizes evaluating the results against those goals rather than focusing only on leaderboard activity. Product Hunt Launch Guide.
2. Track the launch funnel, not just total traffic
A SaaS launch should be measured as a sequence of user actions.
A useful starting model is:
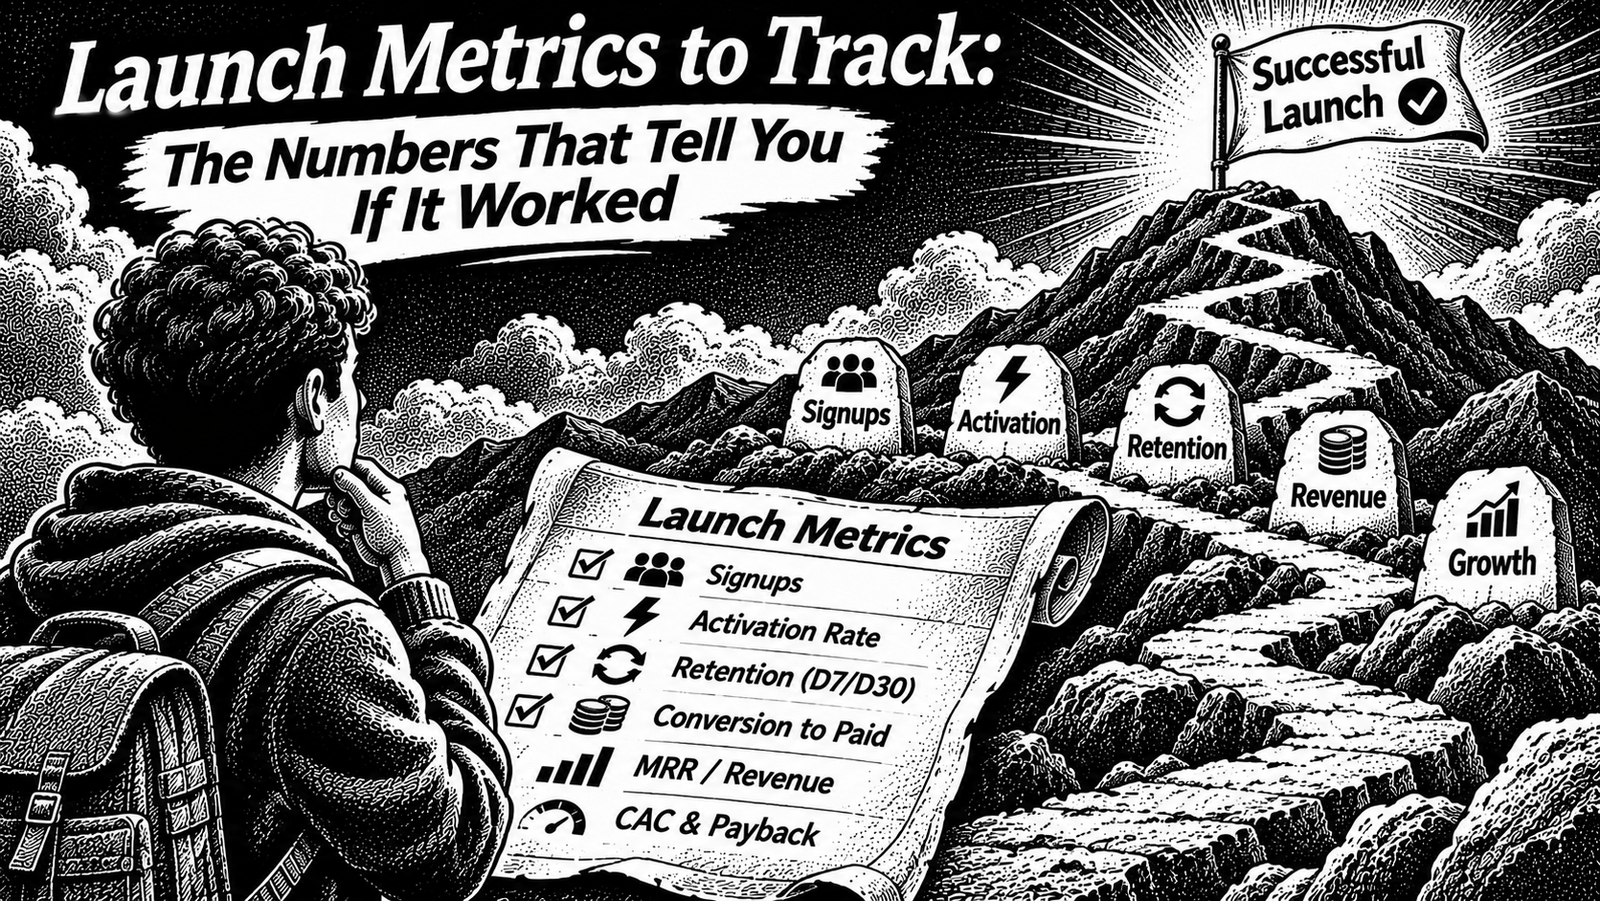
Discovery → Visit → Signup → Activation → Payment → Retention
Each stage answers a different question.
| Stage | Main question | Metric |
|---|---|---|
| Discovery | Did people see the announcement? | Impressions or reach |
| Visit | Did they visit the website? | Landing-page visitors |
| Signup | Did they show enough interest to register? | Signup conversion rate |
| Activation | Did they experience the product’s core value? | Activation rate |
| Payment | Did they become paying customers? | Trial-to-paid or signup-to-paid conversion |
| Retention | Did they continue using or paying for the product? | Cohort retention |
This distinction matters because a large number at the beginning of the funnel does not automatically mean a successful launch.
For example, impressions can be high while website visits are low. Website visits can be high while signups are low. Signups can be high while activation is poor.
Track each stage separately so you know where users are dropping out.
3. The essential launch metrics
You do not need dozens of metrics. Start with the following groups.
A. Reach and discovery metrics
These show whether people encountered your launch.
1. Impressions
The number of times content or a listing was displayed.
Examples include social post impressions, launch-platform impressions and Google Search impressions.
Be careful when combining platform numbers. Each service may define and count impressions differently, so report them separately.
2. Landing-page visitors
The number of people who visited your product’s landing page during the launch period.
Use a clearly defined visitor measure, such as unique users, and keep it consistent when comparing periods.
A visitor is not necessarily a potential customer. Someone arriving from an unrelated audience may have little interest in your product.
3. Traffic by source
Record where website visitors came from.
Examples:
- Product Hunt
- Hacker News
- X
- Direct traffic
- Organic Google Search
- Partner or referral websites
Use consistent UTM parameters for campaigns you control. For example:
?utm_source=reddit&utm_medium=community&utm_campaign=launch
UTM parameters help analytics systems identify campaign sources, but make sure your naming conventions remain consistent. Avoid creating several different source names for the same channel.
4. Click-through rate
When you have both impressions and clicks for the same placement, calculate:
CTR = Clicks ÷ Impressions × 100
For example, 40 clicks from 2,000 impressions gives a 2% click-through rate.
Do not compare CTR across unrelated platforms as though they use identical definitions and audiences.
B. Interest and signup metrics
These tell you whether people who arrived were interested enough to take the next step.
5. Signup conversion rate
A basic landing-page signup calculation is:
Signup conversion rate = Unique visitors who completed signup ÷ Unique eligible landing-page visitors × 100
Illustrative example:
- Unique landing-page visitors: 500
- Completed signups: 40
- Signup conversion rate: 40 ÷ 500 × 100 = 8%
Use the same time period and visitor definition in the numerator and denominator. Exclude internal testing and obvious duplicate activity where possible.
Do not mix sessions in the denominator with unique people in the numerator without clearly labelling the calculation.
6. Qualified signup rate
A signup is not necessarily a good-fit user.
Define what makes someone qualified for your product. This may involve their role, business type, use case or whether they have the problem your SaaS solves.
For a B2B product, 20 signups from businesses in your intended market may be more informative than 100 signups from people who only wanted to explore a free tool.
A simple calculation is:
Qualified signup rate = Qualified signups ÷ Total signups × 100
Write down your qualification criteria before evaluating the results. Do not change the criteria simply to make the launch look better.
C. Activation metrics
Activation tells you whether new users reached the product’s core value.
7. Activation rate
First define an activation event: the action that demonstrates that a new user has experienced the main benefit of your product.
Examples:
| Product type | Possible activation event |
|---|---|
| Project management | Creates a project and completes a task |
| Invoicing | Creates and sends a first invoice |
| Email marketing | Sends a first campaign |
| Analytics | Connects a data source and views a report |
| Team collaboration | Invites a teammate and completes a shared workflow |
Then calculate:
Activation rate = New signups who completed the activation event ÷ Total eligible new signups × 100
Suppose 40 users sign up and 18 complete the activation event.
Activation rate = 18 ÷ 40 × 100 = 45%.
This is an illustrative calculation, not a benchmark.
Choose an activation event that represents actual value. Merely logging in or viewing the dashboard may not be enough.
Google Analytics lets you designate important user actions as key events and examine them in reports, including by acquisition source. This can help connect acquisition activity to meaningful product actions. Google Analytics: About key events.
8. Time to first value
Measure how long it takes a new user to reach the activation event.
For example, consider a reporting tool:
- Signup completed
- Data source connected
- First useful report generated
The time from signup to the first useful report gives you a practical view of setup friction.
You can use the median time for a group of users to reduce the influence of unusually long or short sessions. State clearly whether you measure calendar time or active time.
D. Revenue metrics
If the product offers paid plans, measure whether launch interest turns into actual revenue.
9. New paying customers
Count the customers who started a paid subscription or made a qualifying purchase during the launch period.
Keep trials, free accounts and test transactions separate from genuine paid customers.
10. Trial-to-paid conversion rate
For a product with a free trial:
Trial-to-paid rate = Eligible trial users who became paying customers ÷ Eligible users in that trial cohort × 100
Only compare cohorts that have had enough time to complete the trial and convert.
Do not divide current paid customers by all historical signups and label the result trial-to-paid conversion.
11. New MRR
For a subscription SaaS, record the new monthly recurring revenue from customers acquired during the period.
Keep one-time payments, setup fees and other non-recurring charges separate from MRR.
For annual subscriptions, document the monthly normalization method you use. Do not compare inconsistent MRR definitions across reporting periods.
12. Revenue by acquisition source
Where you can attribute a customer to a source with reasonable confidence, record the recurring revenue associated with that source.
This helps answer a more useful question than “Which channel produced the most visitors?”
It tells you which channel brought customers who actually paid.
Attribution is not perfect. Someone may discover a product through a community post and return through a direct visit later. Record the attribution method and avoid claiming that a single touchpoint caused the purchase.
E. Early retention metrics
A launch can produce signups and paid customers without creating lasting usage.
13. Returning users
Count how many new users return after their first meaningful product experience.
Choose a period that makes sense for the product. A daily workflow tool and a tool used once per month should not be judged using identical return windows.
14. Cohort retention
Group users by when they signed up or became customers, then observe whether they remain active or paying over time.
For example:
| Signup cohort | Day 7 | Day 30 |
|---|---|---|
| Week 1 | Active users remaining | Active users remaining |
| Week 2 | Active users remaining | Active users remaining |
| Week 3 | Active users remaining | Not yet mature |
Do not compare cohorts with different amounts of elapsed time. A recent signup cohort has not had the same opportunity to reach Day 30 as an older cohort.
For subscription products, distinguish product activity from paid subscription retention. A paying customer may be inactive, while an active user may still be on a free plan.
F. Feedback and product quality
Not every useful launch signal is a number.
15. Useful feedback
Track feedback that reveals:
- What problem the user wanted to solve.
- What they understood about the product.
- Where they became confused.
- Which workflow they attempted.
- What prevented them from completing it.
- What alternative they currently use.
Count repeated themes, but preserve the actual context. Ten vague positive comments are not necessarily more informative than one detailed report from a target customer.
16. Product errors and support issues
Monitor signup errors, failed actions, broken integrations and support requests during the launch period.
A technical failure can make a promising product look unattractive. Record the number of affected users and the point in the workflow where the issue occurred.
Do not assume that every user who leaves has a product-quality problem. Use error logs and direct feedback to establish whether there is a connection.
4. Compare channels using downstream outcomes
One of the most useful launch analyses is a comparison of traffic sources.
Do not stop at the number of visitors from each channel.
Use a table like this:
| Source | Visitors | Signups | Activated | Paid |
|---|---|---|---|---|
| Product Hunt | 300 | 18 | 6 | 1 |
| 100 | 15 | 10 | 3 | |
| 60 | 12 | 9 | 4 | |
| Direct | 40 | 5 | 3 | 1 |
All numbers above are hypothetical, created only to illustrate how a channel report can be read. They are not IndieOS results or industry benchmarks.
In this example, Product Hunt brought the largest number of visitors, while email produced the most paying customers relative to its visitor count.
That does not prove email will always be the best channel. The audience sizes, source attribution and user intent differ. But it tells you that judging the launch by total traffic alone would miss important information.
For each source, calculate:
- Visitor-to-signup rate.
- Signup-to-activation rate.
- Signup-to-paid rate, where the cohort is mature enough.
- Revenue attributed to the source, when defensible.
Google Analytics’ User acquisition report provides acquisition dimensions and key event information that can help examine user actions by source. Google Analytics: User acquisition report.
For Google Search specifically, use Search Console to inspect impressions, clicks, CTR, queries and average position. Those are search-performance metrics, not a replacement for product analytics or total website traffic. Google Search Console: Performance report.
5. Set up a simple launch measurement system
You do not need a complicated analytics stack to start measuring a launch.
A useful basic setup contains three parts.
1. Website analytics
Use an analytics service to measure landing-page visitors, traffic sources and important website actions.
For example, Google Analytics can record events and report key events across acquisition sources.
At minimum, consider tracking:
| Event | What it represents |
|---|---|
landing_page_view | Product landing page was viewed |
primary_cta_click | Visitor clicked the main call to action |
signup_started | Signup process began |
signup_completed | Account creation completed |
activation_completed | User completed the defined first-value action |
trial_started | Eligible trial began |
subscription_started | Paid subscription began |
These are suggested event names for a measurement plan, not a claim that every analytics tool uses them automatically.
2. Product analytics
Measure what happens after signup.
You need to know whether users complete the main workflow, where they stop and whether they return.
Start with the smallest set of events that explains your activation path. Do not track every button click unless it helps answer a real product question.
3. A launch scorecard
Create one spreadsheet or dashboard for the launch.
Suggested columns:
| Field | Example |
|---|---|
| Metric | Activation rate |
| Definition | Signups completing the first-value event |
| Target | Your pre-launch goal |
| Actual | Observed result |
| Reporting window | First 7 days |
| Acquisition source | All sources or a named channel |
| Data source | Analytics / billing / support |
| Notes | Missing events, duplicates, unusual traffic |
Write down the definition before launch. Otherwise, changing the denominator or event definition halfway through can make results impossible to compare.
6. When should you review launch metrics?
A single launch-day report is not enough.
Use a few clearly defined reporting windows.
Launch day
Check whether the launch is working operationally:
- Is the landing page available?
- Are links working?
- Are visitors arriving?
- Can users complete signup?
- Are product events being recorded?
- Are payments working, if applicable?
- Are critical errors occurring?
This is an operational check, not a final business verdict.
First 7 days
Review the early funnel:
- Which sources brought visitors?
- How many completed signup?
- Which users activated?
- What feedback or support issues appeared?
- Did any customers pay?
Record the date range and distinguish incomplete trial cohorts from mature ones.
First 30 days
Review early customer quality:
- Which acquisition sources produced useful users?
- Are users returning?
- Are paying customers continuing to use the product?
- Are there repeated cancellation reasons?
- Which workflows show the largest drop-off?
A 30-day review is a useful reporting window, not a universal proof period. Some products need longer usage cycles before retention can be interpreted meaningfully.
7. Do not confuse launch attention with product traction
Some launch platforms display leaderboards, points, votes, comments or other engagement indicators.
These can tell you whether the launch attracted attention within that community. They cannot tell you by themselves whether customers received value or will pay.
Product Hunt’s documentation explains that its points and leaderboard ranking reflect more than raw upvotes, including other engagement signals. That is another reason not to treat a simple upvote count as a complete measure of success. Product Hunt: What are points?.
Use platform engagement as a channel-specific metric.
Then connect it to your own website and product data:
- Did platform visitors reach the website?
- Did they understand the offer?
- Did they sign up?
- Did they complete the core workflow?
- Did any become paying customers?
A launch can perform well on a community leaderboard and still produce few customers. It can also attract little public attention while bringing in a small number of highly relevant users.
Judge the result against the objective you selected before launch.
8. A worked example: reading a launch scorecard
The following is a fictional example to demonstrate how the metrics fit together.
Suppose a small SaaS runs a public launch and records:
| Stage | Illustrative result |
|---|---|
| Landing-page visitors | 500 |
| Completed signups | 40 |
| Activated users | 18 |
| New paying customers | 4 |
Now calculate the funnel.
Visitor-to-signup rate
40 ÷ 500 × 100 = 8%
Signup-to-activation rate
18 ÷ 40 × 100 = 45%
Signup-to-paid rate
4 ÷ 40 × 100 = 10%
Activated-to-paid rate
4 ÷ 18 × 100 = 22.2%
These calculations describe the hypothetical funnel. They do not establish whether the product is successful or whether the rates are good.
Next, ask what the numbers mean:
- Did the 500 visitors match the intended customer profile?
- Did the 40 signups understand what the product does?
- Why did 22 users not complete activation?
- Did the four paying customers use the product’s main workflow?
- Which traffic source produced the strongest customers?
- Has enough time passed to evaluate retention?
The answers determine what you should investigate next.
Do not immediately redesign the website, add features or spend more on promotion. First identify the earliest stage where the evidence suggests a problem.
9. Your launch metrics checklist
Before launch
- Write down the primary launch objective.
- Define what a successful result means.
- Choose the metrics connected to that objective.
- Define the signup and activation events.
- Set up traffic-source tracking.
- Test analytics events before launch.
- Exclude internal and test activity where possible.
- Prepare the launch scorecard.
During launch
- Check that the website and signup flow work.
- Monitor visitors by acquisition source.
- Check CTA clicks and completed signups.
- Confirm activation events are recorded.
- Monitor payment and product errors.
- Record useful customer feedback.
- Keep platform engagement separate from product outcomes.
After launch
- Review the first 7-day funnel.
- Compare acquisition channels.
- Review activation and payment outcomes.
- Check early retention when enough time has passed.
- Record missing or unreliable data.
- Document what the launch actually demonstrated.
- Decide which question needs investigation next.
Frequently asked questions
What are the most important metrics to track during a SaaS launch?
Start with landing-page visitors, traffic source, signups, activation and paying customers. Add retention and revenue measures as the customer cohort matures. The exact priorities depend on your launch objective.
How do you measure whether a product launch was successful?
Compare the actual results with goals defined before the launch. Look at whether relevant visitors arrived, whether users signed up, whether they experienced the product’s core value and whether meaningful customer or revenue outcomes followed.
Is Product Hunt upvote count a useful launch metric?
It is useful for understanding engagement on Product Hunt, but it is not a complete measure of product traction. Connect platform activity to website visits, signups, activation and paid customers.
Should I track website traffic or signups?
Track both. Traffic shows whether people reached the website. Signups show whether visitors took a next step. Neither tells you alone whether the product delivered value.
What is the difference between signup rate and activation rate?
Signup rate measures how many visitors created an account. Activation rate measures how many eligible new users completed a meaningful action inside the product.
How long should I wait before judging launch results?
Review operational issues immediately, early funnel activity during the first week and customer behavior over a longer period appropriate to your product. Do not judge retention using cohorts that have not had enough time to mature.
Which tools can I use to track SaaS launch metrics?
You can begin with Google Analytics for website and event measurement, Google Search Console for organic Search performance, your billing provider for payment outcomes and a simple spreadsheet for qualitative feedback and the launch scorecard. Add product analytics only when you need deeper behavior analysis.
Final takeaway
A launch is more than a spike in website traffic or a leaderboard position.
The useful question is what happened after someone discovered your product.
Did the right people visit? Did they understand the offer? Did they sign up? Did they experience the core value? Did anyone pay? Did users return?
Track those stages using consistent definitions, compare acquisition sources and record what the data cannot tell you.
That gives you a much better foundation for your next launch decision.
The next step is to turn your launch results into a clear retrospective and decide what to change.
Sources and further reading
- Product Hunt: Launch Guide
- Product Hunt: What are points?
- Google Analytics: About key events
- Google Analytics: User acquisition report
- Google Search Console: Performance report
- Google Search Console: Impressions, position and clicks
Tool terminology and platform guidance checked on 1 November 2026. Verify the current interface and your own analytics configuration before implementation.



[…] you have already organized your launch numbers, use the launch metrics to track article when it is published. The metrics review and the retrospective serve different purposes: […]
[…] For a wider view of the metrics worth monitoring after launch, see launch metrics to track. […]
[…] For the wider measurement framework, see Launch Metrics to Track. […]