Table of Contents
Your SaaS website may be getting visitors, but are those visitors taking the next step?
Someone reads your headline, looks at a screenshot, scrolls through the features and then leaves. Another visitor clicks the signup button but never completes the form. A third creates an account and discovers that the product is not quite what the page promised.
These are different problems. Treating all of them as a single traffic problem can lead to the wrong fix.
Your SaaS landing page conversion rate helps you understand how often visitors complete the primary action you want them to take. For a live SaaS product, that action might be starting a trial, creating an account or requesting a demo.
This guide focuses on improving an existing product page that is already receiving visitors. It is not a guide to testing a new idea with a pre-build landing page, writing a launch announcement or collecting pre-launch waitlist signups. Those are different stages with different goals.
You will learn how to define the right conversion, interpret a benchmark without treating it as a target, find friction in the visitor journey and prioritise practical improvements.
This guide focuses on a live product page. For a pre-launch page whose job is to collect interest, see how to build a SaaS waitlist. For the wider process of reaching and growing an audience, read how to build an audience for a SaaS product.
What a SaaS landing page conversion rate actually measures
A landing page conversion rate is the proportion of visitors who complete a defined action after arriving on a page.
For a SaaS product, the primary action could be:
| Page goal | Primary conversion |
|---|---|
| Self-serve SaaS | Completed account signup |
| Free-trial product | Trial started |
| Demo-led SaaS | Qualified demo request |
| Sales-led SaaS | Submitted sales enquiry |
| Paid product | Completed purchase |
Do not mix these actions into one number without explaining what you are measuring.
A demo request is not the same commitment as creating a free account. A visitor who downloads a guide has not necessarily become a product lead. A pricing-page click is useful behaviour, but it is not the same as a completed signup.
The basic conversion formula
For a visitor-based calculation:
Landing page conversion rate = (Unique visitors who completed the primary action ÷ Unique landing-page visitors) × 100
You can also calculate a session-based rate:
Session conversion rate = (Sessions containing the primary action ÷ Sessions that started on the landing page) × 100
Choose one definition and use it consistently when comparing periods, traffic sources or page versions.
This distinction matters when using analytics. Google Analytics 4’s Landing page report uses session-scoped landing-page data. Do not compare a session-based rate directly with a visitor-based benchmark as though they are identical.
Measure the whole path, not just the button click
A SaaS landing page often sits at the beginning of a longer journey:
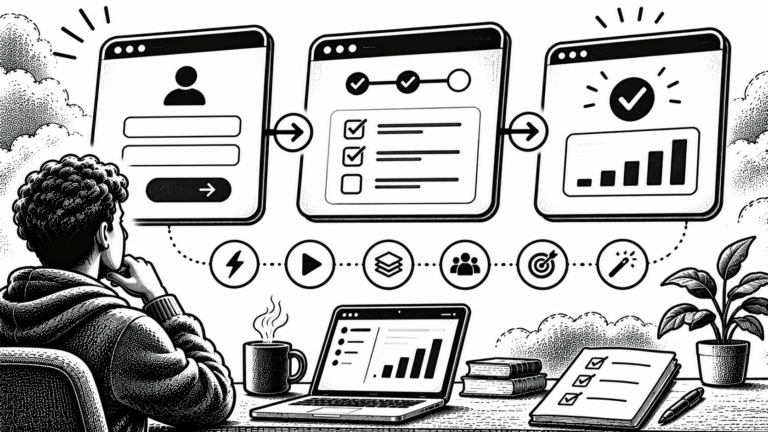
Landing page visit → CTA click → signup form → account created → activation → paid customer
Each step answers a different question.
- Did the page explain the product clearly?
- Did the visitor understand the call to action?
- Did the signup form create unnecessary friction?
- Did the new account reach a useful first outcome?
- Did the user see enough value to consider paying?
Your landing page may be converting visitors into signups successfully while the product struggles to activate those users. That is not necessarily a landing-page copy problem.
For product-level testing, see What to Test in a SaaS MVP. The landing-page promise should match what the product can actually deliver after signup.
When evaluating a page during a product launch, compare its results with the wider launch metrics to track, rather than relying on one conversion figure. The longer-term goal is to turn qualified visitors into customers, which connects to the path to $1,000 MRR.
What is a good SaaS landing page conversion rate?
There is no single conversion rate that every SaaS landing page should reach.
The answer depends on the audience, traffic source, offer, product category, visitor intent and action being measured.
A visitor arriving from a detailed comparison search may behave differently from someone clicking a broad social post. A free signup also asks for less commitment than a demo request that requires a business email and a scheduled call.
A published benchmark to use carefully
Unbounce’s 2024 Conversion Benchmark Report reports a 3.8% median conversion rate for SaaS landing pages, compared with a 6.6% median across all industries.
These figures come from Unbounce’s analysis of landing-page data collected between 23 July 2023 and 23 July 2024. Its methodology describes more than 464 million unique visitors, 57 million conversions and over 41,000 landing pages. It also explains that pages with fewer than 50 visitors or no conversions, and categories with fewer than 400 pages, were excluded.
Sources:
The 3.8% figure is useful context, not a target you should copy.
There are several reasons to be careful:
- The dataset covers a defined period, not every SaaS landing page in 2026.
- Your page may have a different conversion action.
- The traffic mix may be different from the one in the report.
- A conversion count does not tell you the commercial value of each conversion.
- The data comes from Unbounce’s platform dataset, not a universal census of all SaaS websites.
The report itself notes that its analysis focuses on conversion events rather than the value of each conversion. A page generating fewer but better-qualified demo requests may be more valuable to its business than a page generating many low-intent signups.
Use benchmarks to ask better questions, not to declare that your page is failing.
Compare your page with itself first
For a small SaaS, your own historical data is often the most useful starting point.
Compare the same page across:
- Similar date ranges.
- The same conversion definition.
- The same traffic source.
- The same device category.
- Similar campaigns and offers.
- Comparable visitor intent.
A conversion rate that changes after a major traffic-source shift may not indicate a page problem. The people arriving may simply have different expectations.
9 practical fixes to improve a SaaS landing page
A good optimisation process does not begin with a redesign. It begins with understanding what the visitor needs to know and where the current page makes that difficult.
1. Make the main promise understandable immediately
Your opening section should answer three questions:
- What is the product?
- Who is it for?
- What useful outcome does it help deliver?
Avoid opening with a vague statement such as:
“Transform your workflow with next-generation innovation.”
The visitor cannot tell what the software does or whether it is relevant.
A more useful structure is:
[Product category] for [target user] that helps you [specific outcome].
For example, a fictional appointment scheduling SaaS might use:
“Appointment scheduling for independent consultants. Manage client bookings, reminders and rescheduling from one place.”
This is more specific. It tells the visitor what the software is and who may benefit.
Do not promise an outcome that the product cannot support. If the product does not offer automated reminders, do not imply that it does.
What to check: Ask someone unfamiliar with the product to read the first screen. Can they explain what the product does and who it is for without asking you for clarification?
2. Make the primary call to action obvious
A visitor should not have to guess what to do next.
Choose one primary action for the page. Depending on the product, it may be:
- Start free trial.
- Create an account.
- Book a demo.
- Get started.
- See pricing.
The wording should describe what happens after the click.
“Submit” does not explain the benefit. “Start your free trial” is clearer when a free trial is genuinely available and the terms are accurately explained.
You can have secondary actions, such as viewing a product demo or reading documentation, but do not make every button look equally important.
Also check the destination. A button that says “Start free” should not lead to an unexpected pricing page or a form that immediately requests payment details without explaining why.
What to check: Open the page as a new visitor and follow the primary CTA. Does the next screen deliver the action the button promised?
3. Show the product instead of describing everything
Software is often difficult to evaluate from text alone.
A visitor may want to see what the dashboard looks like, how a workflow operates or what happens after signup.
Use product visuals that help answer those questions:
- A genuine product screenshot.
- A short demonstration of the main workflow.
- A simple diagram of the process.
- A relevant feature comparison.
- A short explanation of the first useful task.
Do not use a generic illustration where an actual product view would be more informative. Do not use an AI-generated visual and present it as a screenshot of the real application.
A screenshot should also have context. Instead of showing an unexplained dashboard, write a short caption explaining what the visitor is looking at and why it matters.
What to check: Can a visitor understand at least one important product workflow without creating an account?
4. Add proof that addresses the visitor’s doubts
A landing page makes claims. Visitors need a reason to believe them.
Useful proof may include:
- Customer testimonials with permission.
- Genuine product reviews.
- A real case study with attributable results.
- Screenshots of actual product functionality.
- Clear security and privacy information.
- A transparent explanation of limitations.
- Relevant integrations and supported workflows.
Do not invent customer logos, star ratings, testimonials or user counts. A fabricated proof element is worse than having no testimonial section.
If you are early and have no testimonials, show the product clearly and explain how it works. You can also publish documentation, a changelog or a working demonstration.
Trust is not created by adding more badges. It comes from evidence that supports the promise.
5. Remove unnecessary signup friction
Every additional field or confusing step gives a visitor another reason to stop.
Review the signup process:
| Field or step | Question to ask |
|---|---|
| Name | Is it needed before the person can use the product? |
| Phone number | Is there a clear reason to request it now? |
| Company size | Does it affect the first product experience? |
| Business email | Is it necessary for this signup model? |
| Password | Can the process be made clearer without reducing security? |
| Verification | Is the step explained and functioning correctly? |
| Payment details | Is payment information required for the offer shown on the page? |
Do not remove security or verification simply to increase signup volume. The objective is to remove unnecessary friction, not necessary safeguards.
Make errors clear. If an email address is invalid, explain what needs to change. Preserve completed fields when an error occurs. Make password requirements visible before submission.
If your product uses a demo-led sales process, do not copy a self-serve signup form. Ask only for information that is useful to qualify or prepare for the meeting.
What to check: Complete the signup process on mobile and desktop. Note every unexpected field, unclear instruction, validation error and unnecessary page transition.
6. Match the page to the traffic source
A visitor arriving from a search query has a different starting point from someone arriving through a founder’s social post.
For example:
- Someone searching “appointment scheduling for consultants” may want to compare solutions.
- Someone clicking a product announcement may want to understand what is new.
- Someone following a tutorial may want to see a specific feature.
- Someone arriving from a referral may already know the product.
Your landing page should continue the conversation that brought the visitor there.
If a campaign promises a particular feature, show that feature. If an article links to a product page after explaining a workflow, make sure the page explains how the product supports that workflow.
In Google Analytics 4, the Landing page report can be combined with the Session source / medium dimension to inspect which traffic sources lead to each landing page.
What to check: Review the page by source and medium. Are visitors from different sources reaching a page that matches the message they clicked?
7. Improve the mobile experience
Your page may look polished on a desktop and still be difficult to use on a phone.
Check:
- Is the headline readable without excessive wrapping?
- Is the primary CTA visible and easy to tap?
- Are important screenshots readable?
- Does the page require unnecessary horizontal scrolling?
- Do forms work with mobile keyboards?
- Are navigation menus easy to use?
- Do popups cover the main content?
- Does the page remain stable while images load?
Unbounce’s SaaS benchmark report says that 79% of the landing-page visits in its dataset came from mobile devices. That is a useful reason to inspect the mobile experience, but it should not be treated as a measurement of your own audience.
What to check: Test the real page on a phone, not only in a desktop browser’s responsive preview. Complete the primary action from start to finish.
8. Make pricing and limitations easier to understand
Pricing uncertainty can stop an interested visitor from taking the next step.
You do not need to publish every commercial detail on the first screen, but visitors should be able to understand the offer before making a commitment.
Explain relevant details such as:
- Whether the product is free, paid or trial-based.
- What the free plan includes, if one exists.
- When a trial ends.
- Whether a payment method is required.
- What happens when the trial expires.
- Which important features require a paid plan.
- Whether there are usage limits.
Avoid using “free” when the visitor must pay before accessing the advertised feature. Make recurring charges and renewal terms clear wherever users are asked to subscribe.
For the wider product journey, the IndieOS guide to how to reduce churn in an early-stage SaaS covers what happens after signup and why the first customer experience matters.
What to check: Ask a new visitor to explain the pricing model and the next payment commitment after reading the page. If they cannot, clarify the offer.
9. Improve page speed and remove technical problems
A page that loads slowly or behaves unpredictably can interrupt the visitor before they reach the CTA.
Inspect:
- Large images and videos.
- Unnecessary third-party scripts.
- Heavy animations.
- Fonts and layout shifts.
- Broken buttons and forms.
- JavaScript errors.
- Slow server responses.
- Unnecessary redirects.
Google’s Core Web Vitals guidance describes three user-experience metrics:
| Metric | Good experience target |
|---|---|
| Largest Contentful Paint (LCP) | 2.5 seconds or less |
| Interaction to Next Paint (INP) | Less than 200 milliseconds |
| Cumulative Layout Shift (CLS) | Less than 0.1 |
These are web experience targets, not conversion-rate guarantees. A good score does not prove that your offer or messaging is persuasive, but a technically poor page can make the experience harder than it needs to be.
What to check: Use PageSpeed Insights and the Core Web Vitals report in Search Console. Also submit the form and test the CTA. A performance score cannot tell you whether the actual signup flow works.
How to diagnose a weak SaaS landing page conversion rate
Before changing the page, identify where visitors are dropping out.
Use this diagnostic sequence:
Step 1: Check whether the right visitors are arriving
Look at traffic source, campaign, search query where available, device and landing page.
A page may appear to convert poorly because it receives visitors who are not interested in the product. Changing the headline will not fix a mismatch between the audience and the offer.
For organic traffic, use Google Search Console’s Performance report to inspect search queries, impressions, clicks and click-through rate. For on-page behaviour, use Analytics.
Step 2: Identify the first weak step
Break the journey into measurable events:
| Funnel step | What to measure |
|---|---|
| Page visit | Landing-page sessions or visitors |
| CTA interaction | Primary CTA clicks |
| Signup started | Form or registration started |
| Signup completed | Account successfully created |
| Activation | User reaches the first useful product outcome |
| Paid conversion | User becomes a paying customer |
If many people visit but few click the CTA, investigate the message, audience fit and offer.
If CTA clicks are healthy but form completions are weak, inspect the form and signup process.
If signups are healthy but activation is poor, investigate the product onboarding rather than changing the landing page blindly.
Step 3: Compare segments instead of relying on one total
Review the conversion rate for meaningful groups:
- Mobile versus desktop.
- Organic search versus referral.
- Different campaign sources.
- New versus returning visitors.
- Demo requests versus self-serve signups.
- Different product pages or audience segments.
Do not split the data into so many small groups that every comparison becomes unreliable. Start with segments that could reasonably explain a difference in visitor intent or user experience.
Step 4: Record the problem before changing anything
Write down what you observed, what you think is causing it and what evidence supports that explanation.
For example:
| Observation | Possible explanation | Evidence to inspect |
|---|---|---|
| Visitors do not click the CTA | Offer is unclear or audience is mismatched | Headline, traffic source and page message |
| CTA clicks happen but signups do not | Signup process creates friction | Form errors and completion events |
| Mobile completion is lower | Mobile layout or input issues | Real-device testing |
| Signups occur but activation is weak | Page promise and product experience may not align | First-session product behaviour |
Treat the explanation as a hypothesis until you have checked it.
A simple landing-page audit worksheet
Use this original IndieOS working checklist to review one live product page. It is a diagnostic aid, not a validated industry benchmark or a claim that completing every item will increase conversions.
| Area | Audit question | Finding |
|---|---|---|
| Audience | Is the intended customer obvious? | Pass / Review |
| Value proposition | Can a visitor explain the main benefit? | Pass / Review |
| Headline | Does it describe what the product does? | Pass / Review |
| CTA | Is there one clear primary action? | Pass / Review |
| Product proof | Can visitors see the real product? | Pass / Review |
| Trust | Are claims and testimonials genuine? | Pass / Review |
| Form | Are all requested fields necessary? | Pass / Review |
| Pricing | Are costs and trial terms clear? | Pass / Review |
| Mobile | Can a visitor complete the primary action on a phone? | Pass / Review |
| Performance | Does the page load and respond reliably? | Pass / Review |
| Analytics | Is the primary action measured correctly? | Pass / Review |
| Product fit | Does the product deliver what the page promises? | Pass / Review |
After the audit, choose one issue to work on first. Keep a record of the page version, the change, the reason for making it and the metric you will observe.
How to test landing-page improvements without guessing
A test should begin with a specific hypothesis.
A useful experiment brief contains:
Problem: What is happening on the current page?
Evidence: What data, user feedback or usability observation supports the problem?
Change: What exactly will you alter?
Primary metric: Which action should the change improve?
Guardrail: What must not get worse?
Review period: When will you inspect the result?
For example:
- Problem: Visitors cannot tell whether the product is designed for independent consultants or larger agencies.
- Evidence: Questions from customer conversations show repeated confusion about the target user.
- Change: Rewrite the headline and supporting line to identify the intended customer.
- Primary metric: Completed account signups per landing-page session.
- Guardrail: Signup activation should not deteriorate.
- Review: Compare the same traffic sources and devices before and after the change.
This is an illustrative experiment brief, not a report of an experiment that IndieOS has run.
Do not run tests that your traffic cannot support
A low-traffic SaaS may not have enough visitors to draw a reliable conclusion from a conventional A/B test quickly.
In that situation:
- Fix clear usability defects first.
- Interview relevant users about what they understand.
- Watch real sessions only with appropriate privacy safeguards.
- Test the signup flow manually.
- Make one clearly documented change.
- Compare the same metric over comparable periods.
- Record uncertainty rather than declaring a winner too early.
A before-and-after change is not automatically proof that the change caused the difference. Traffic sources, seasonality, campaigns and other events may also have changed.
Frequently asked questions
What is a good SaaS landing page conversion rate?
There is no universal target. Unbounce’s 2024 report gives a 3.8% median for SaaS landing pages in its dataset, but the appropriate comparison depends on the conversion action, visitor source and audience. Treat it as context rather than a requirement.
How do I calculate a SaaS landing page conversion rate?
Divide the number of visitors who complete the defined primary action by the total number of visitors to the landing page, then multiply by 100. Keep the denominator and conversion action consistent when comparing results.
Should a SaaS landing page have more than one CTA?
It can have secondary actions, but the primary action should remain clear. Avoid giving unrelated actions equal visual weight when they compete for the same visitor’s attention.
Should I redesign my landing page if conversions are low?
Not automatically. First check traffic quality, messaging, CTA clicks, form completion, mobile behaviour and analytics setup. A full redesign may be unnecessary when the problem is limited to one section or one step of the funnel.
Does page speed affect SaaS landing page conversion?
Performance is part of the user experience. Slow loading, delayed interaction and unstable layouts can make a page difficult to use. Measure Core Web Vitals and test the actual signup journey, but do not assume that improving a performance score guarantees more signups.
How often should I optimise a SaaS landing page?
Review the page when meaningful evidence suggests a problem, when the offer changes, when traffic behaviour shifts or when product positioning changes. Avoid making random edits just to keep the page feeling new.
Should my landing page explain every product feature?
No. Explain enough for the intended visitor to understand the product, its main benefit and the next step. Show supporting features where they help a decision, but do not make visitors work through a long feature catalogue before understanding the offer.
Final takeaway
A SaaS landing page does not convert because it has more sections, more animations or more buttons.
It converts when the right visitor understands the offer, trusts the information, sees a relevant next step and can complete that action without unnecessary friction.
Measure one meaningful conversion. Check where people drop out. Improve the weakest part of the journey and record what changed.
The goal is not to chase a benchmark. It is to make your live product page clearer and more useful for the people it was built to serve.
Sources and further reading
- Unbounce: SaaS Landing Page Conversion Benchmark
- Unbounce: Conversion Benchmark Report Methodology
- Google Analytics 4: Landing Page Report
- Google Analytics: How to Measure Key Events
- Google Search Console: Performance Report
- Google Search Central: Core Web Vitals
The Unbounce benchmark data covers 23 July 2023 to 23 July 2024. Platform documentation and measurement guidance checked on 2 November 2026. Recheck current documentation before relying on interface-specific instructions.